The best team in the Czech Extraliga, taken apart properly: how their attack really works, the one system built to switch it off, and the seven games where Sparta nearly pulled it off.
That is what one team, for seven games, did to the best attack in the league. Pardubice scored 3.26 goals a game this season. Against Sparta Praha in the semi-final, 2.43 — a quarter of their offence, switched off.
This is a piece about how Pardubice's attack actually works, the one system built to stop it, and the series where someone very nearly did. It rests on a single idea: a team's style leaves fingerprints in the data — and if you look where the puck actually ends up, you can read the system straight off the ice. So let's read it.
HC Dynamo Pardubice won the Czech Extraliga this season, and if you only read the final table you'd assume they strolled it. They didn't, quite. For seven games in the semi-final, one opponent found something close to an answer — and the way they found it, and the reason it still wasn't enough, is the most useful thing a champion can teach you. So this is that story, told from the data up: what Pardubice actually do, why it is so hard to stop, how one team nearly stopped it anyway — and, at the end, a toolkit for the coaches who'll have to try again next season, at home and in Europe.
Before you can judge a Czech team you have to price the league. A point in the Extraliga is not a point in the NHL and not a point in the Polish league; raw totals flatter some players and bury others. The platform behind this piece carries every skater with a league-difficulty factor and puts them all on one honest axis — the same spine that runs under everything Southpaw publishes. Do that, and the model's verdict on Pardubice is blunt: they are the best team in the competition, and it isn't especially close. The interesting question isn't whether they're good. It's how — and what that "how" is vulnerable to.
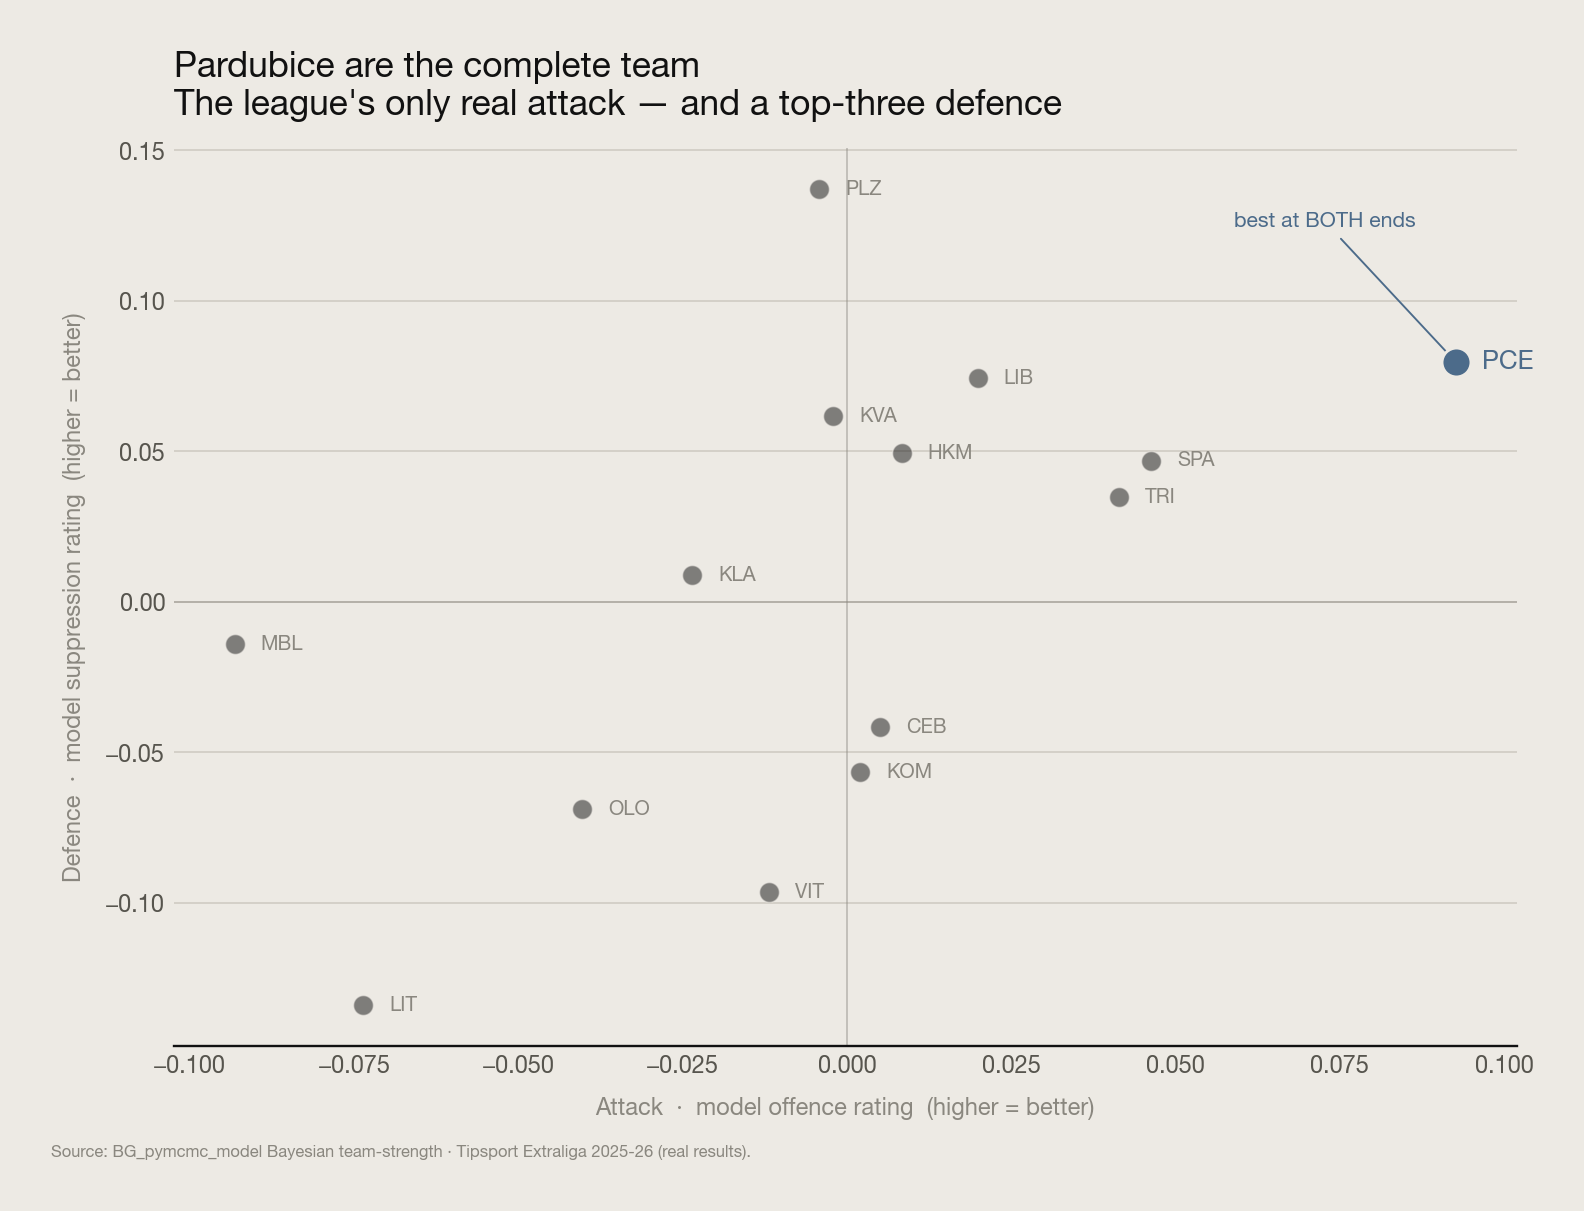
Here is the whole problem in one chart. Every club in the league lives somewhere on two axes — how much they create, how much they concede — and almost everyone is good at one or the other. Plzeň are the league's great wall: elite defence, ordinary attack. Most of the field clusters near the middle. And then there's Pardubice, sitting alone in the top-right corner: the only genuinely positive attack rating in the league, paired with a defence in the top three.
That combination is what makes them so hard to plan for. To beat a one-dimensional team you solve its one dimension — take away Plzeň's structure and they can't score their way out of it. Pardubice give you nothing to solve. They finished first, they own the league's best goal differential at +48, and their scoring is anchored by Roman Červenka, the leading points-getter in the entire competition. You cannot out-attack the best attack or out-defend a top-three defence. So the honest starting question is not "what's their weakness" — it's "which of their two strengths do you have any chance against at all?"
Give Pardubice's game a proper hockey name and it's this — they own the house. "The house", or home plate, is the term for the high-danger area directly in front of the net: the slot, the crease, the middle lane. It is where most goals in hockey are scored and most goals are surrendered, and Pardubice have built their entire identity around controlling that patch of ice at both ends of the rink.
In the offensive zone it looks like a 1-3-1 overload — work the puck low, spread three across the middle, and use low-to-high movement to drag a defender out of the slot so a forward can fill it. In their own end it's the mirror image: a collapsing box that gives up the perimeter and refuses to leave the house, so the shots they concede come from distance. And in the space between, they transition north-south fast enough that a team which just spent a shift defending is suddenly attacking the house the other way. Three phases, one obsession. Watch it below.
You don't have to take the diagram on trust, because Czech hockey publishes where every shot was taken and we've pulled the lot. Below is every one of Pardubice's offensive-zone goals this season, dropping onto the ice at its real coordinates. Watch where they pile up.
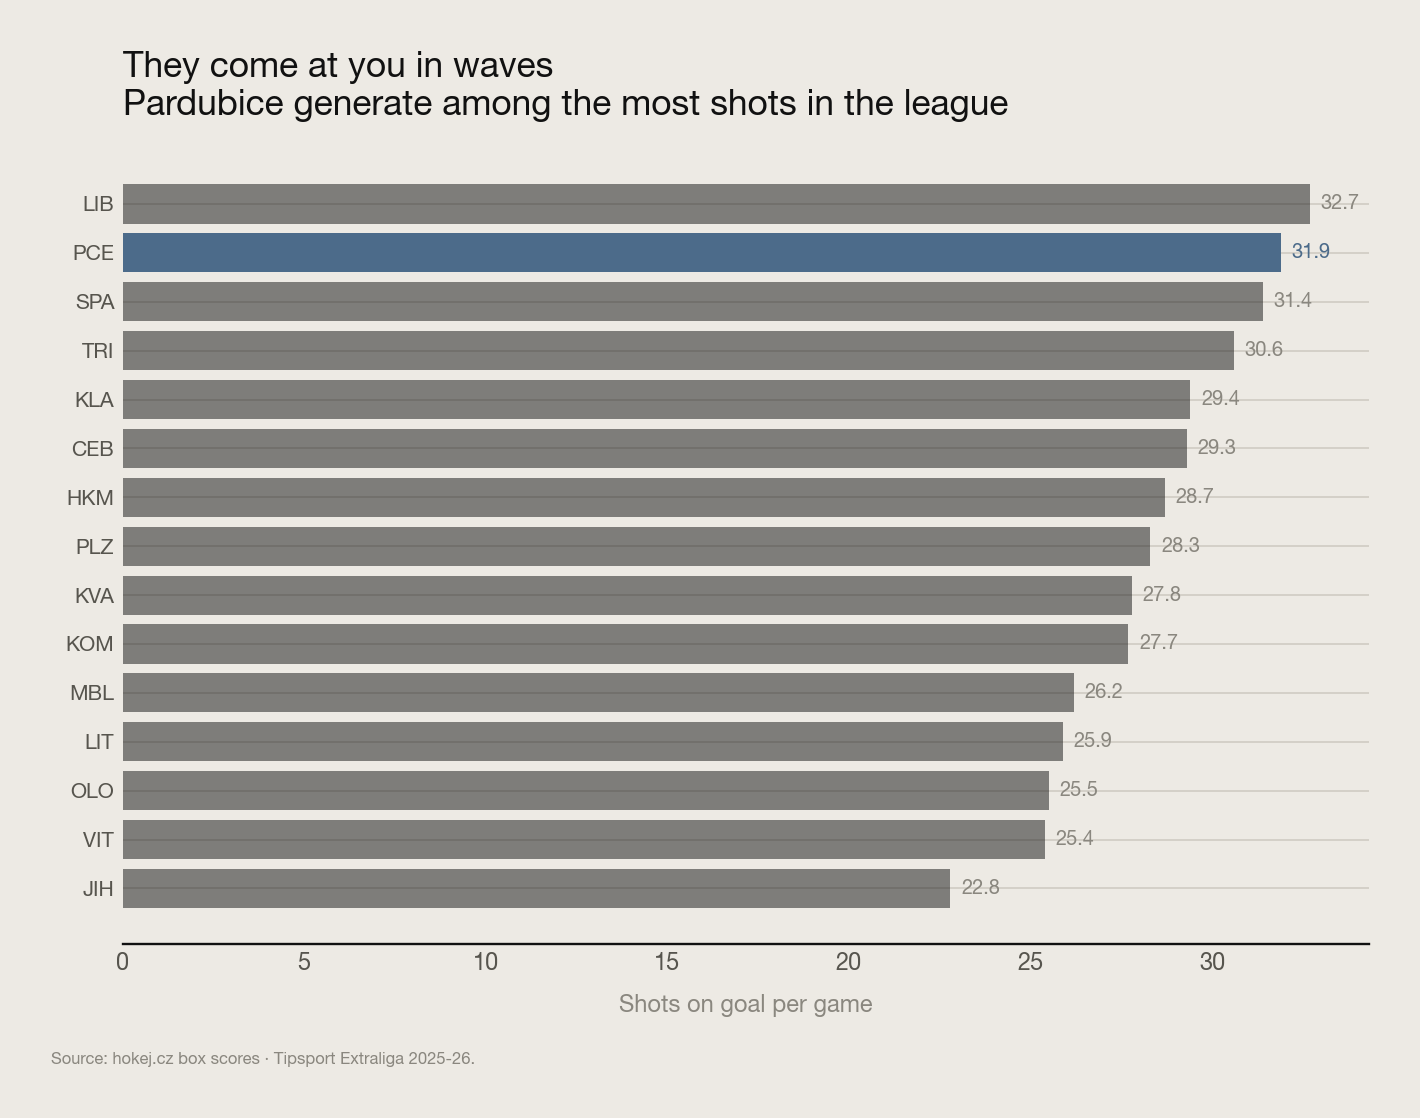
The house. Not the perimeter, not the point — the slot and the crease, over and over, exactly where the system is built to shoot from. And it isn't a handful of pretty goals, it's a flood: Pardubice generate shots at one of the highest rates in the league — close to 32 a game — and finish them at a top clip. Volume and location together are the whole trick. Make a defence protect the most dangerous ice on the sheet thirty-odd times a night and eventually the house breaks. A team that concedes the odd slot chance survives that. A team that concedes them in this quantity, game after game, does not.
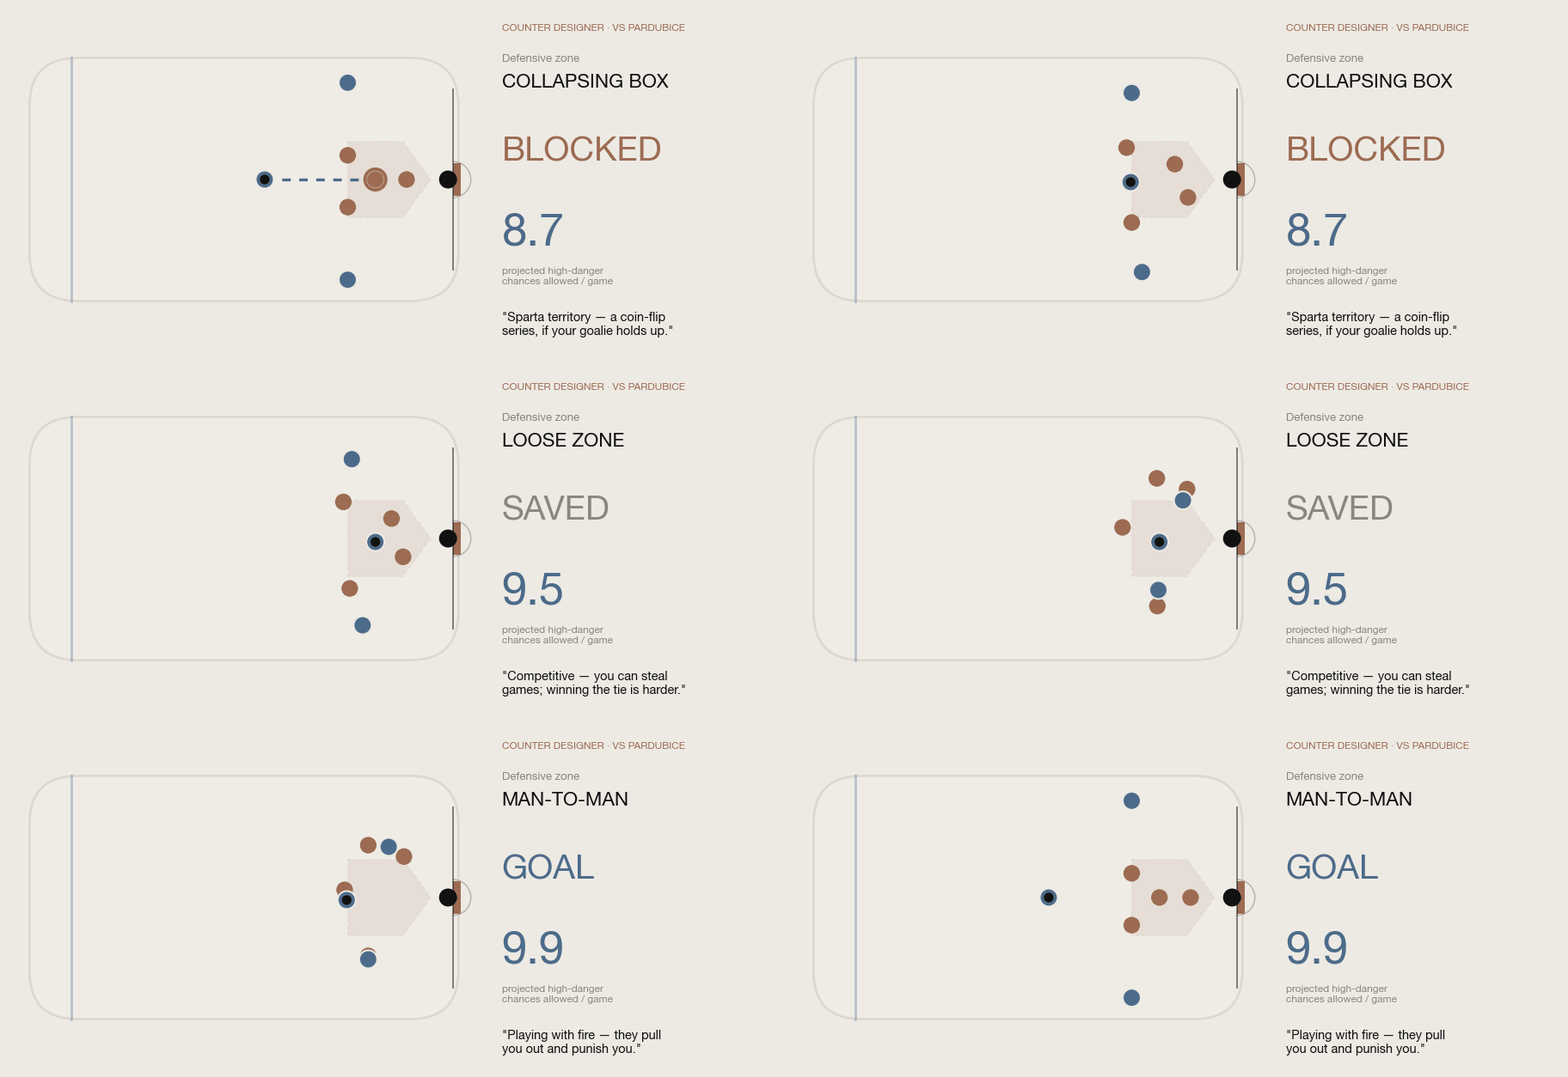
If everything they do aims at the house, the counter writes itself: give them everything except the house. Don't forecheck. Don't pressure the point — pressuring the point is what pulls a defender out of the slot, which is the whole engine of their attack. Instead, collapse five skaters into a tight box in front of your own net, concede the low-danger shot from distance, and dare the best attack in the league to beat you from the outside. You will lose the shot count. You might win the game.
It is the exact opposite of Plzeň's neutral-zone trap. Plzeň make the game boring and win the boring game; this is not about boredom, it's about geography — surrender the ninety percent of the ice that doesn't matter to wall off the ten percent that does. The catch is that it takes nerve and discipline no coach can fake, and a goaltender who'll stand in against a shooting gallery for sixty minutes without blinking. Most teams can't hold the shape for a period. One team held it for seven games.
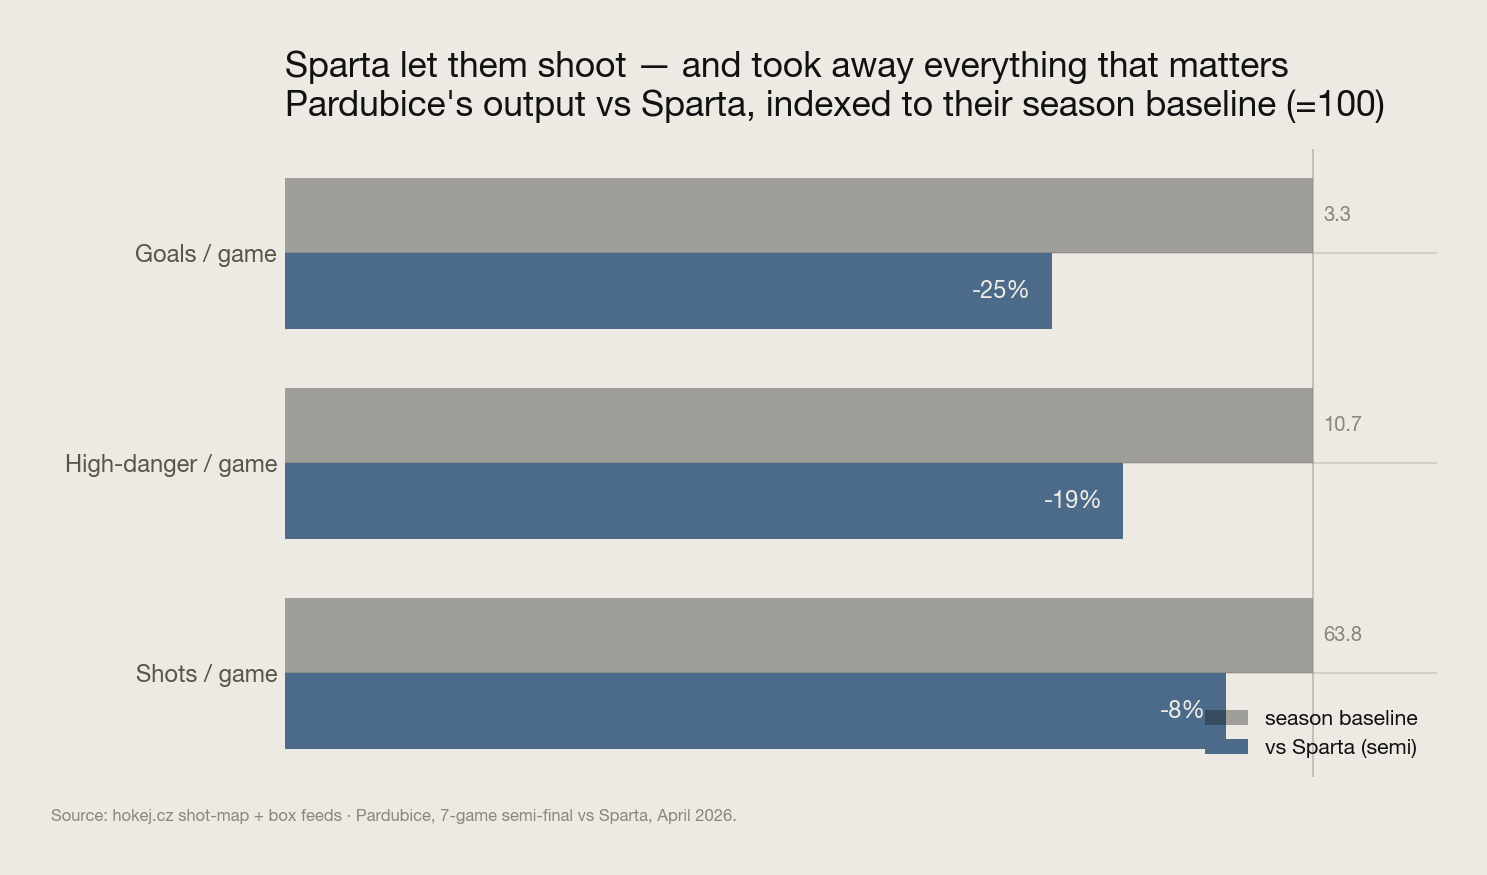
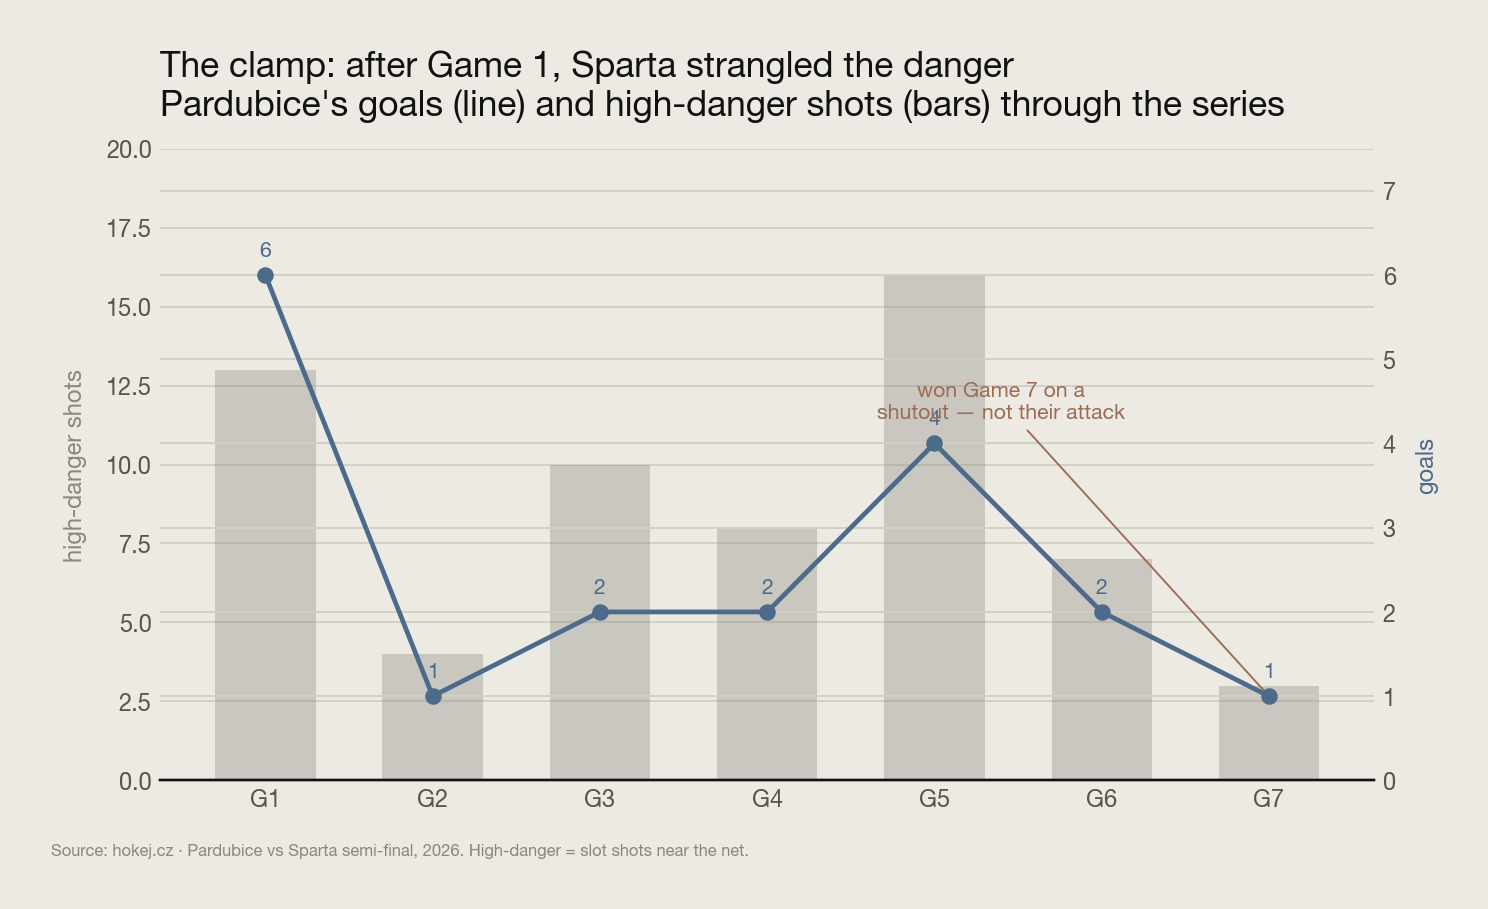
In the semi-finals, Sparta Praha did the un-thinkable-on-paper: they took the league's best attack and turned the taps off. They let Pardubice shoot — shot volume barely moved, and Pardubice actually out-shot them across the series — but they took away the middle and the finish. High-danger chances fell nineteen percent. Goals fell twenty-five. Their shooting percentage collapsed by nearly a fifth. Same team, same net, a completely different game.
How? Discipline, mostly. Sparta refused the bait — no chase, no point pressure — sank into the box, took the house away by simply standing in it, and trusted their goaltender to handle the shots they were happy to concede. Here's the mechanism, one possession at a time.
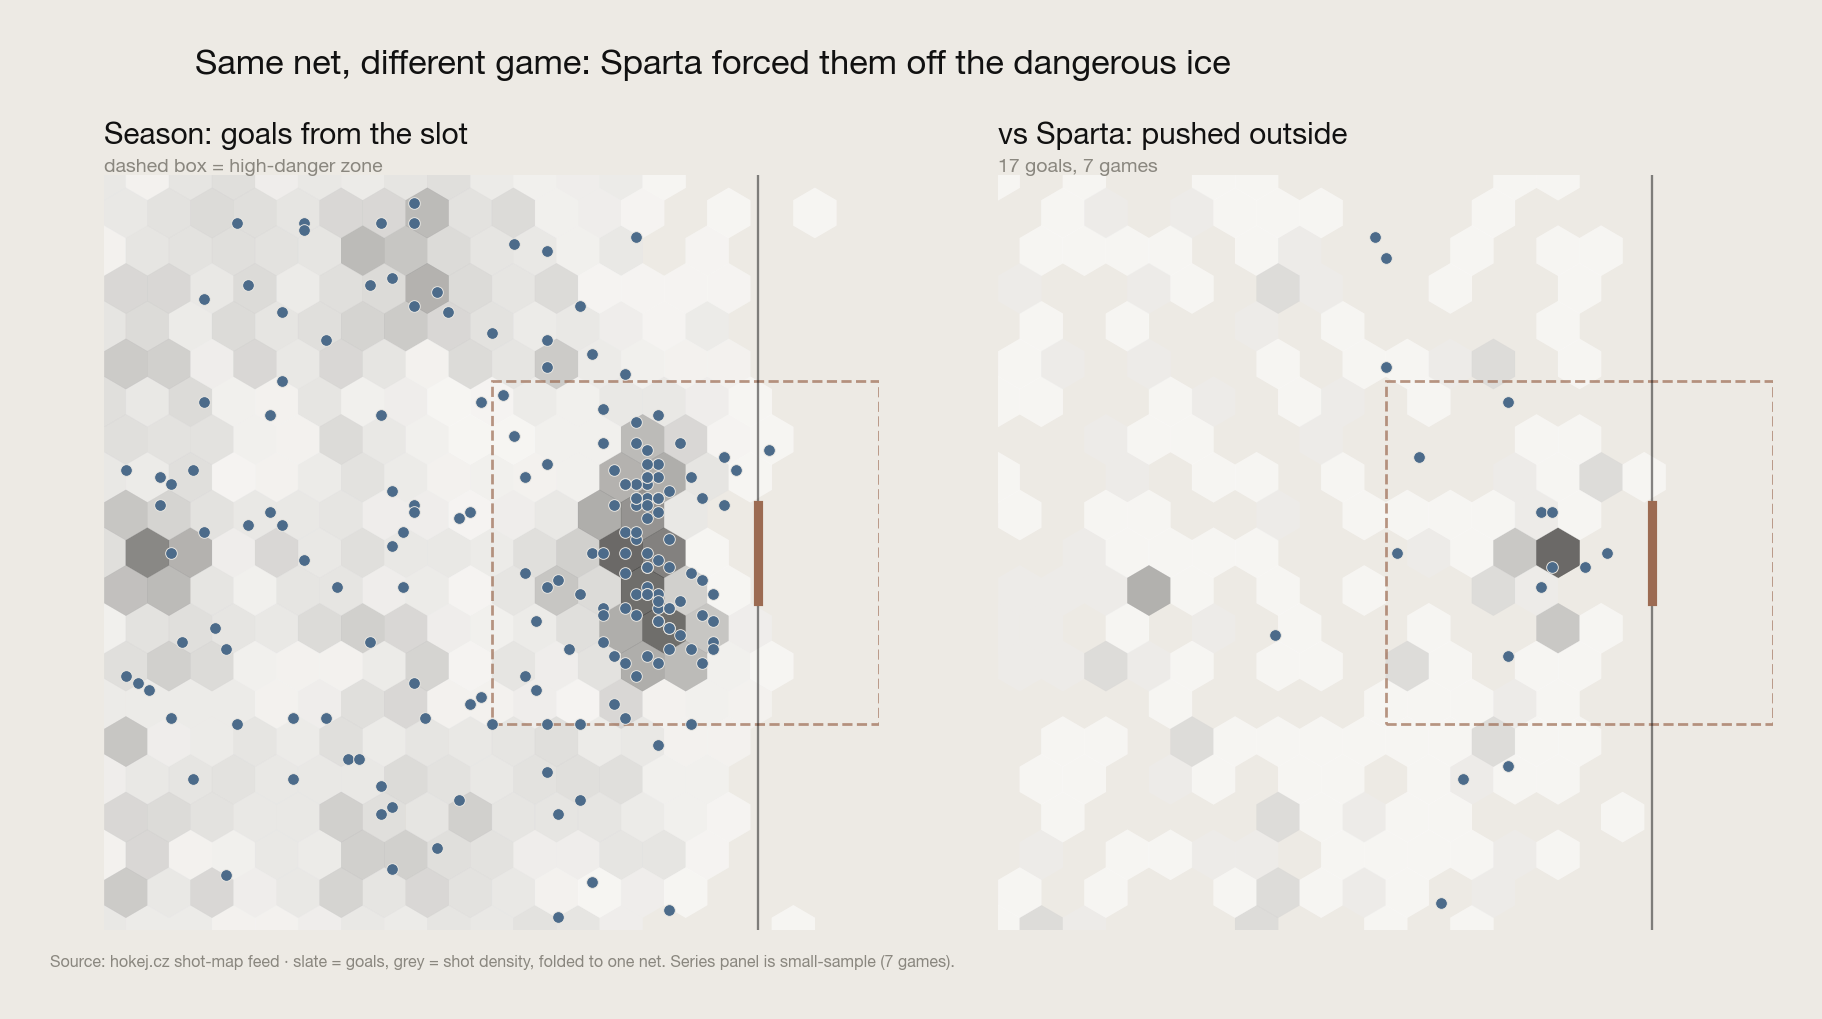
Put the two shot maps side by side and the counter is visible to the naked eye. All season, the goals crowd the house. Against Sparta's box, that same dangerous ice goes quiet and the chances get shoved to the perimeter — exactly where a great attack is least lethal. This is what "neutralised" looks like on a map.
And it held. After Pardubice won Game 1 six-two — the last time all series they looked like themselves — Sparta's box clamped down and the whole thing turned into a grind: 2–1, 2–1, 4–2, 4–3 in overtime, 3–2. The best offence in the league spent a week and a half looking utterly ordinary, and the series went the full seven.
Game 7. The best attack in the league, thoroughly neutralised, managed exactly one goal. And won. 1–0, on a shutout. Read that twice, because it's the entire thesis in a single scoreline: when Sparta finally took the attack away, Pardubice's defence won the series instead.
The data says this plainly. Sparta's box held Pardubice to 2.43 goals a game — but across the same seven games, Pardubice's own defence held Sparta to 2.14, down from Sparta's season rate of 2.91. Both offences got strangled. It became a defensive war — and in a defensive war, the team with the league's second-best defence has the edge. Sparta played the series almost perfectly, solved the one thing everyone said had to be solved, and still lost the margin, because there was a second half of the roster waiting behind the first.
That is what "complete" actually buys you. A one-dimensional team dies when its dimension is solved. A complete team simply changes which way it beats you. Sparta found the one real answer to Pardubice's system — the shot maps prove the answer worked — and it bought them a seventh game and nothing else.
Sparta found the one answer that works, and the trouble for Pardubice is that an answer, once found and written down, stops being a secret. Next season — at home and in the Champions Hockey League — more teams will arrive dressed for the same fight. So here is the toolkit. Choose a system for each phase and watch what it does to them. The model is calibrated to the one hard data point we have, the seven games of Sparta's box, so it isn't a fantasy — it's an extrapolation from the single time it actually happened. There's no magic setting. There is a right shape, and a price for holding it.
Two honest riders. First, the price. The shape that works concedes the puck and the shot count, so it only holds if you have a goaltender willing to face fifty-plus a night and a group disciplined enough not to break structure when the score is level in the third. That is a personnel problem as much as a tactical one — you can draw the box; holding it is the hard part. Second, the venue changes the maths. In the Extraliga it's a best-of-seven, where depth and a goalie's stamina decide whether the box survives a fortnight. In the CHL it's two legs and out — a format that hands even more to variance, where one disciplined night and a hot netminder can knock out a better team, and where the continent's best clubs arrive with both the structure and the skill to punish a lapse. The blueprint travels. Whether your roster can hold it is the whole question.
Pardubice went on to win the title, and for once the model, the data and the eye test all agree on why. They own the house — they attack it, defend it and race to it faster than anyone — and no single system takes that away, because taking away one end just hands the game to the other.
Here's where I'd land, stated the only honest way. There is a real method to hurt them: Sparta's box is the blueprint, and any team with the discipline and the goaltending to hold it can drag Pardubice into a low-event, one-goal series where anything can happen. But "hurt" isn't "beat", and I could be over-reading seven games — it's a small sample, and a bounce or two the other way in Game 5 or Game 7 tells a different story about the same performance. What I won't over-read is the shape of it: the maps, the suppression, and the 1–0 clincher all say the same thing from different directions. You can make Pardubice deeply uncomfortable. Beating them is a separate problem, and nobody in the Czech Extraliga solved it this year.
Talent and structure are knowable. Outcomes aren't. Honest analysis says both out loud — and then goes and watches the games.
Skip if you like. Nothing above claims a method that wasn't actually run.
Every team and player is placed on one axis by reweighting each league's output by its fitted scoring-difficulty factor, then a Bayesian model estimates each club's attack and defence with full uncertainty. Positive is better; for defence, better means more suppression. Every rating carries a credible interval and we lead with the gap, not the decimal.
Czech hockey publishes shot locations. The hokej.cz match visualiser reads a public shot-map feed — roughly a hundred shots per game, each with an x/y coordinate, a shooter, a game clock and a result. We pulled all of it: ~4,400 Pardubice shot events across the season. Every dot on the animated map is an actual goal at its recorded coordinate, folded to a single attacking net so both ends of the rink stack up.
The feed codes each shot's outcome as an integer. We decoded it and, crucially, reconciled it against the independent box score: the "goal" code totals to the real goals scored, the "blocked" code totals to the recorded blocked shots, and goals-plus-saves totals to shots-on-goal. All three tie out, which is how we know the coordinate feed and the box feed are describing the same games.
"High-danger" here means a shot from the home-plate area — close to the net and central, the slot in front of the crease. It's a coordinate rule applied identically to every shot, so a "high-danger chance" means the same thing in the season sample as it does in the Sparta series.
The Sparta comparison is Pardubice's per-game output across the 7-game semi-final against their season baseline (all other games), for the same metrics on the same definitions: shots, high-danger chances, goals and shooting percentage. The "indexed to 100" chart just expresses each series figure as a share of the baseline. The reciprocal — Pardubice's defence holding Sparta to 2.14 goals a game vs a 2.91 season rate — is computed the same way from Sparta's shot events.
Seven games is a small sample and we treat it as one: we show direction, not decimals, and the shot-map comparison panel is explicitly flagged as thin. A different bounce in Game 5 or Game 7 would leave the same underlying performance and a different scoreline — which is exactly why the verdict is a lean with the doubt left in, not a proof.
Both tactical animations — Pardubice's three systems, and Sparta's box — are illustration. We have shot locations, not on-ice player tracking, so the player movement is a depiction of patterns the data is consistent with, never a claim about a specific play or a specific shift. The claims that are data — where the goals are, how far the danger fell against Sparta — are the maps and the numbers, not the diagrams.
The interactive tool is an illustrative model, not a fitted one. Each system option carries a hand-set "house-denial" weight; the combination maps to a projected high-danger rate pinned to two real points — the league baseline, and where Sparta's box actually got to over seven games. It's a teaching instrument for which shapes help and what they cost, not a prediction of a specific matchup.
Results, standings, goals for and against, per-game shots/blocks/faceoffs and the shot-event coordinates are sourced from hokej.cz; the team-strength ratings are the platform's Bayesian fit on those results. One data note carried through the piece: the raw feed's points column is unreliable, so all standings work uses wins, losses and goals directly. Everything here reflects the current data snapshot.